
Power Up Your Presentation
Utilizing my brand and design expertise, I transform data into clear visuals for compelling presentations. I enhance existing materials with your brand, craft polished designs from Word content, or create branded PowerPoint master decks.
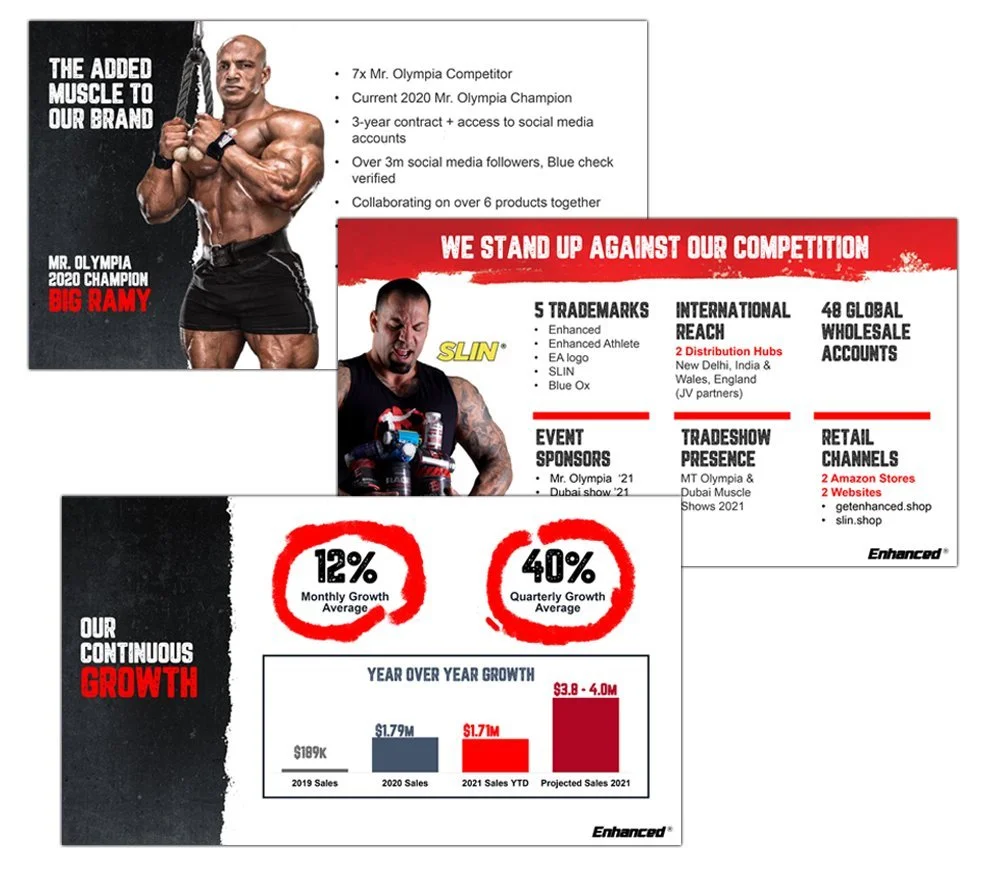
Three promotional images for a bodybuilding brand featuring Mr. Olympia 2020 champion, sponsorship details, growth statistics, and brand trademarks. Text highlights include 7-time Mr. Olympia competitor status, international reach, 5 trademarks, retail channels, and significant growth metrics with monthly and quarterly growth averages.
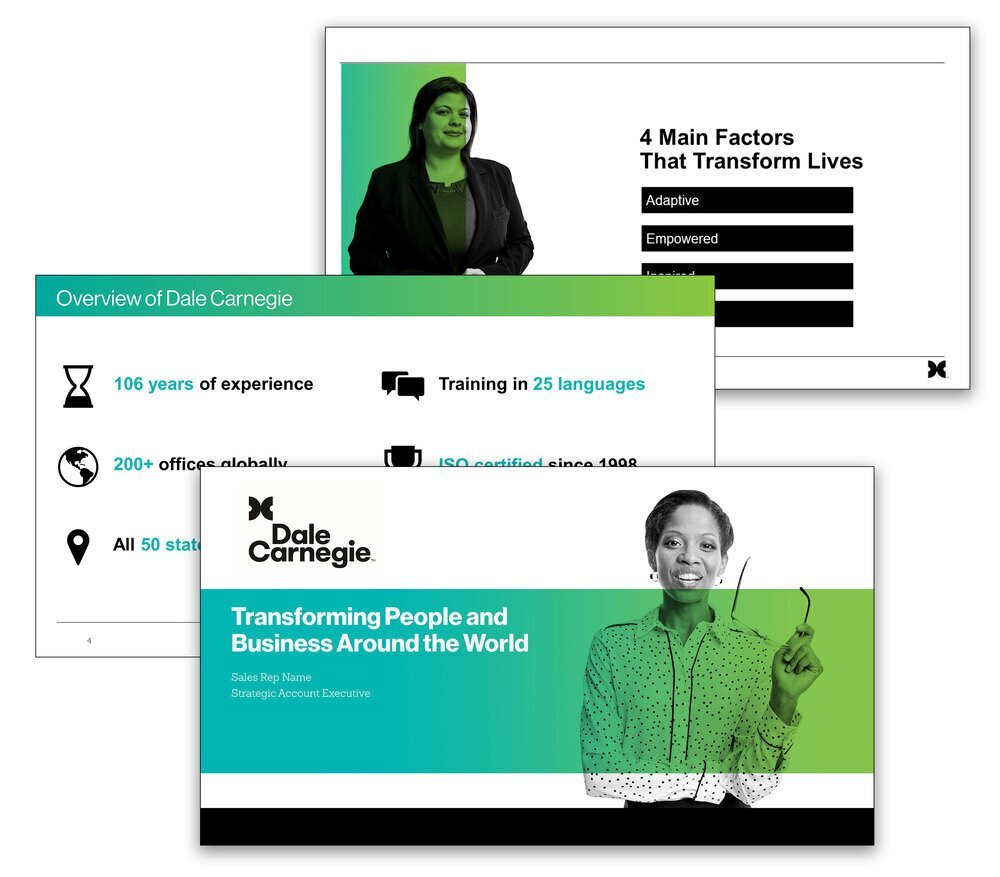
Presentation slides for Dale Carnegie highlighting business achievements and training offerings.

Presentation slide titled 'Patenting of Antibodies after Amgen v. Sanofi' by Lisa Mueller on November 2, 2021, from Casimir Jones. Includes agenda topics on U.S. and European antibody patenting and legal examples. Features a photo of two professionals discussing documents.

Three slide presentation featuring a company called Noonum, focusing on investing, data, and technology. The first slide is an executive summary, the second slide discusses traction with a testimonial and graph, and the third slide outlines a solution process.

Slides from a presentation by The Seminole Companies, focusing on multifamily investment strategies. It includes topics like performance, execution, and investor loyalty. The slides feature images of residential buildings and architectural designs, along with placeholder text.
Before & After Designs
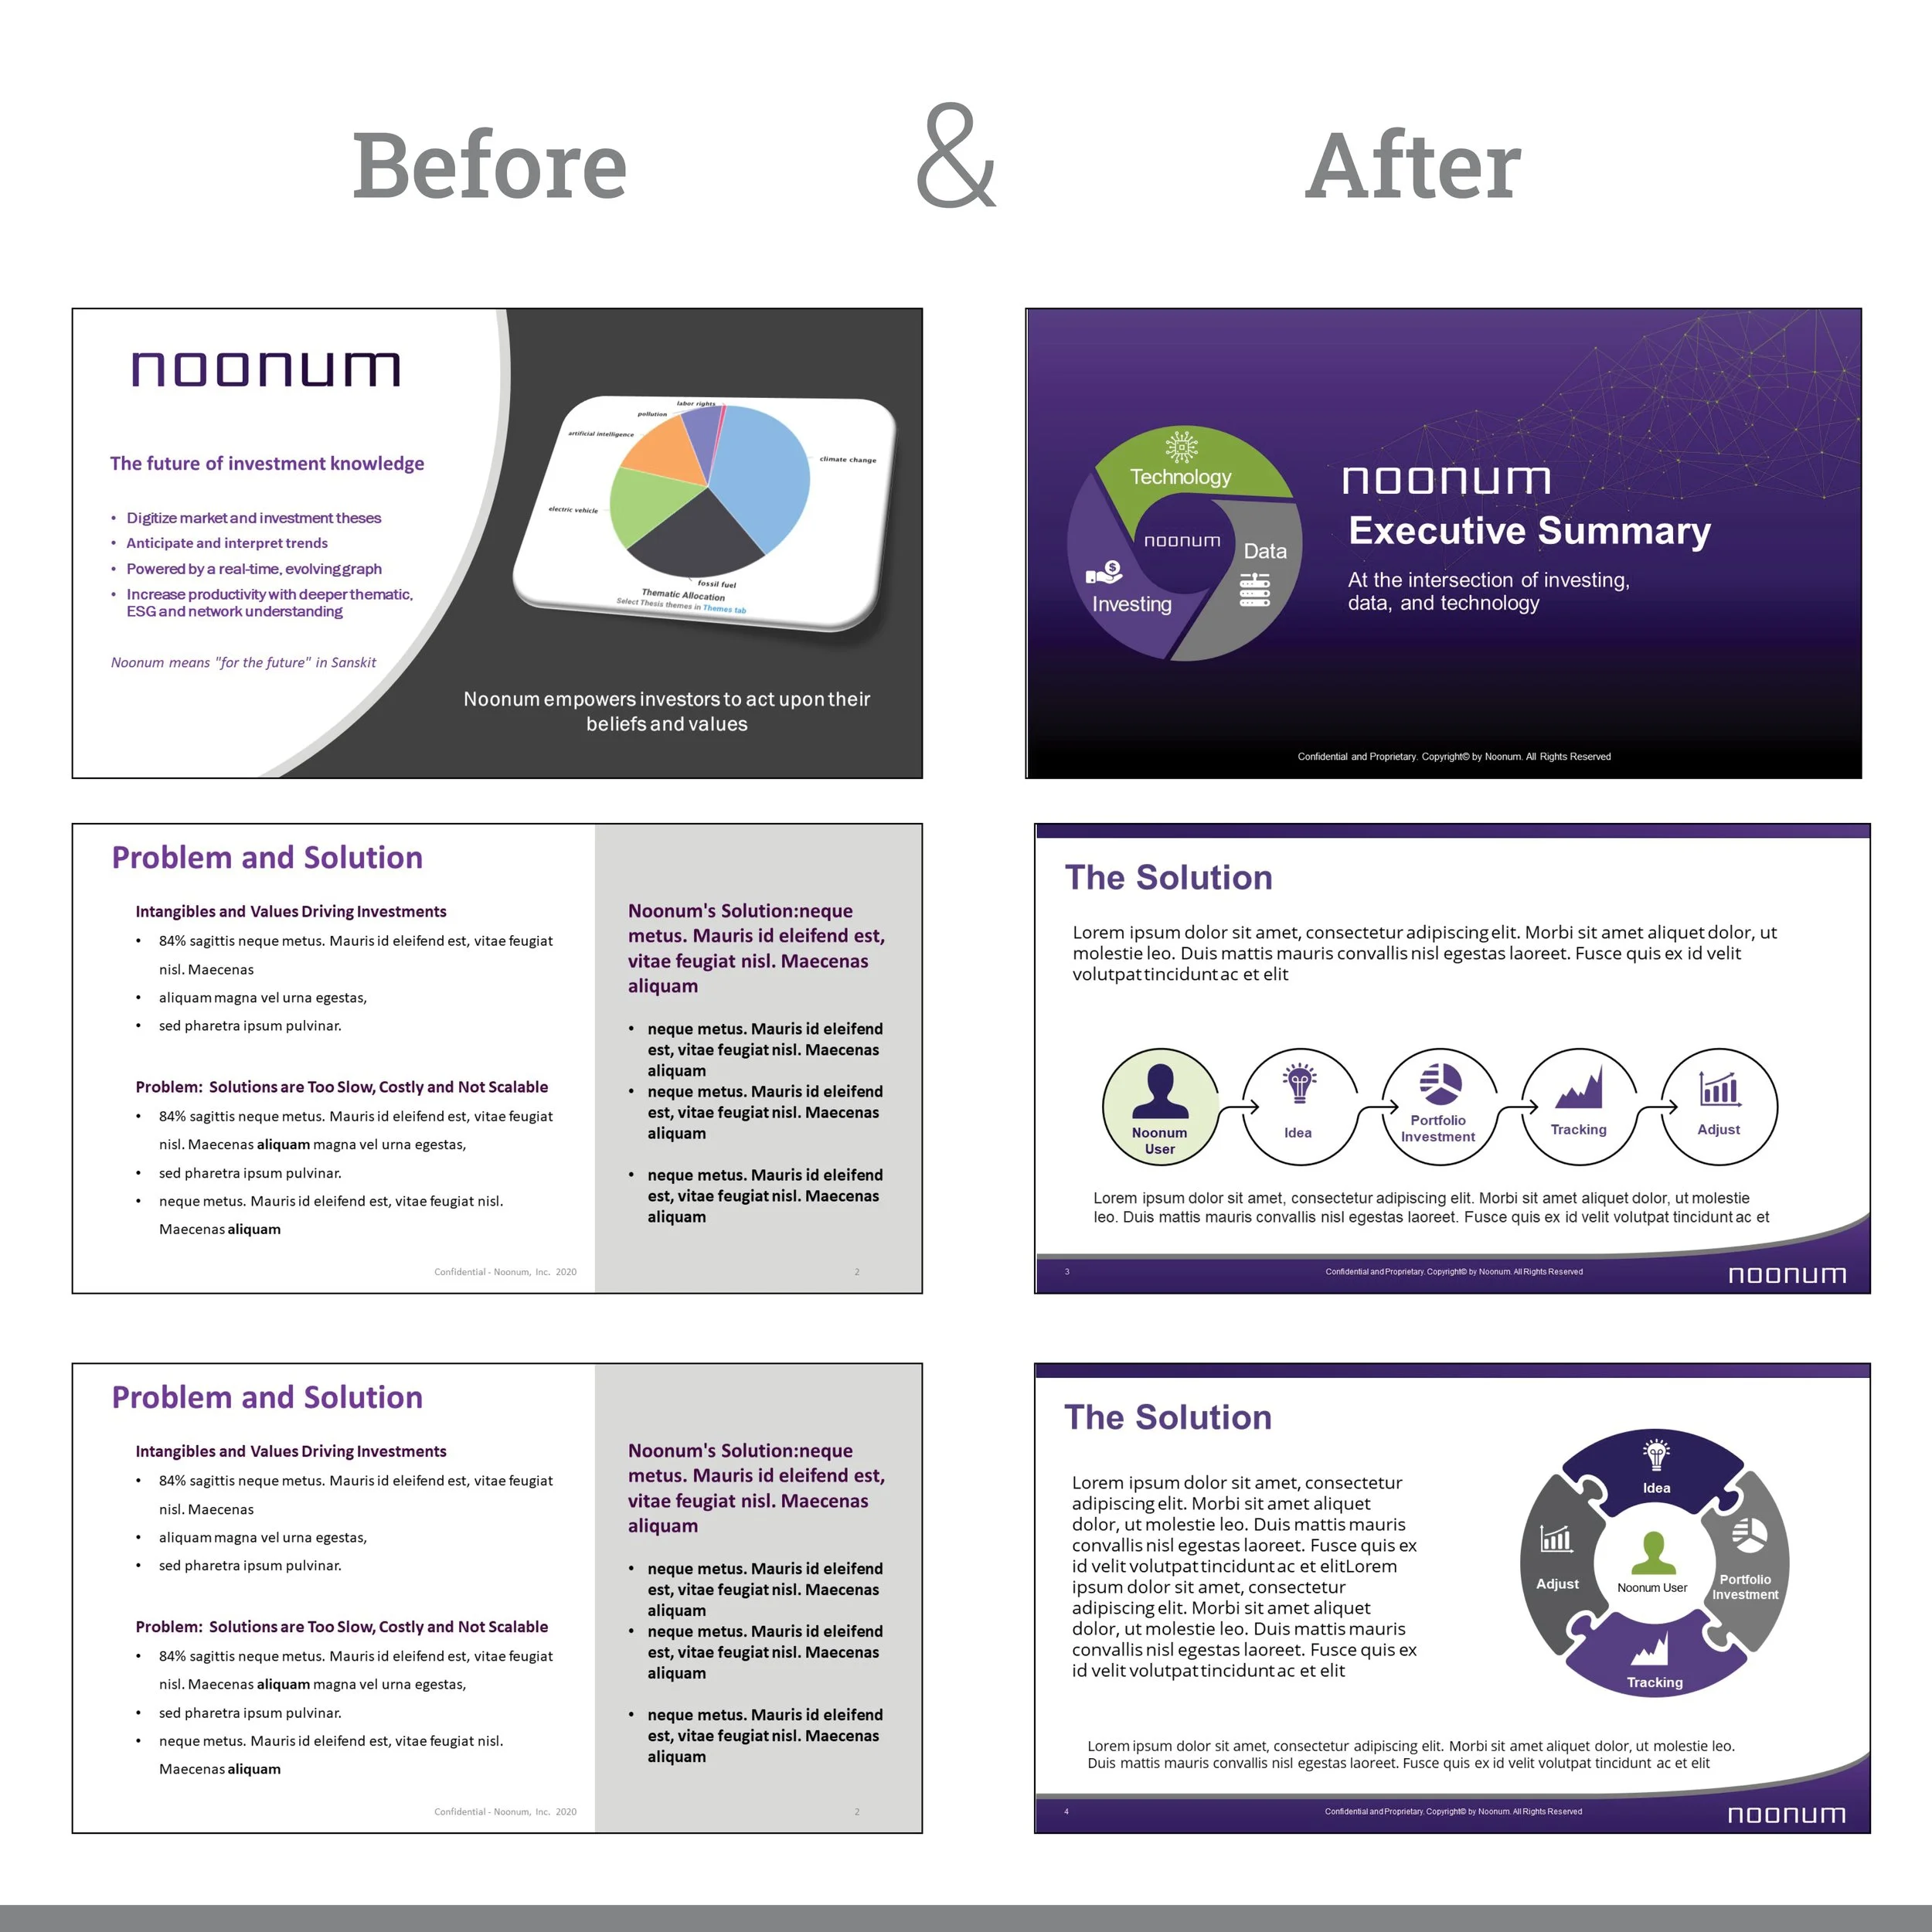
Comparison of 'Before' and 'After' designs for 'Noonum' presentation slides. The 'Before' slides have a simple design with a pie chart and basic text, while the 'After' slides feature a more modern design with purple hues, icons, and refined typography. The 'After' slides emphasize technology, investing, and data with an executive summary and solution focus.
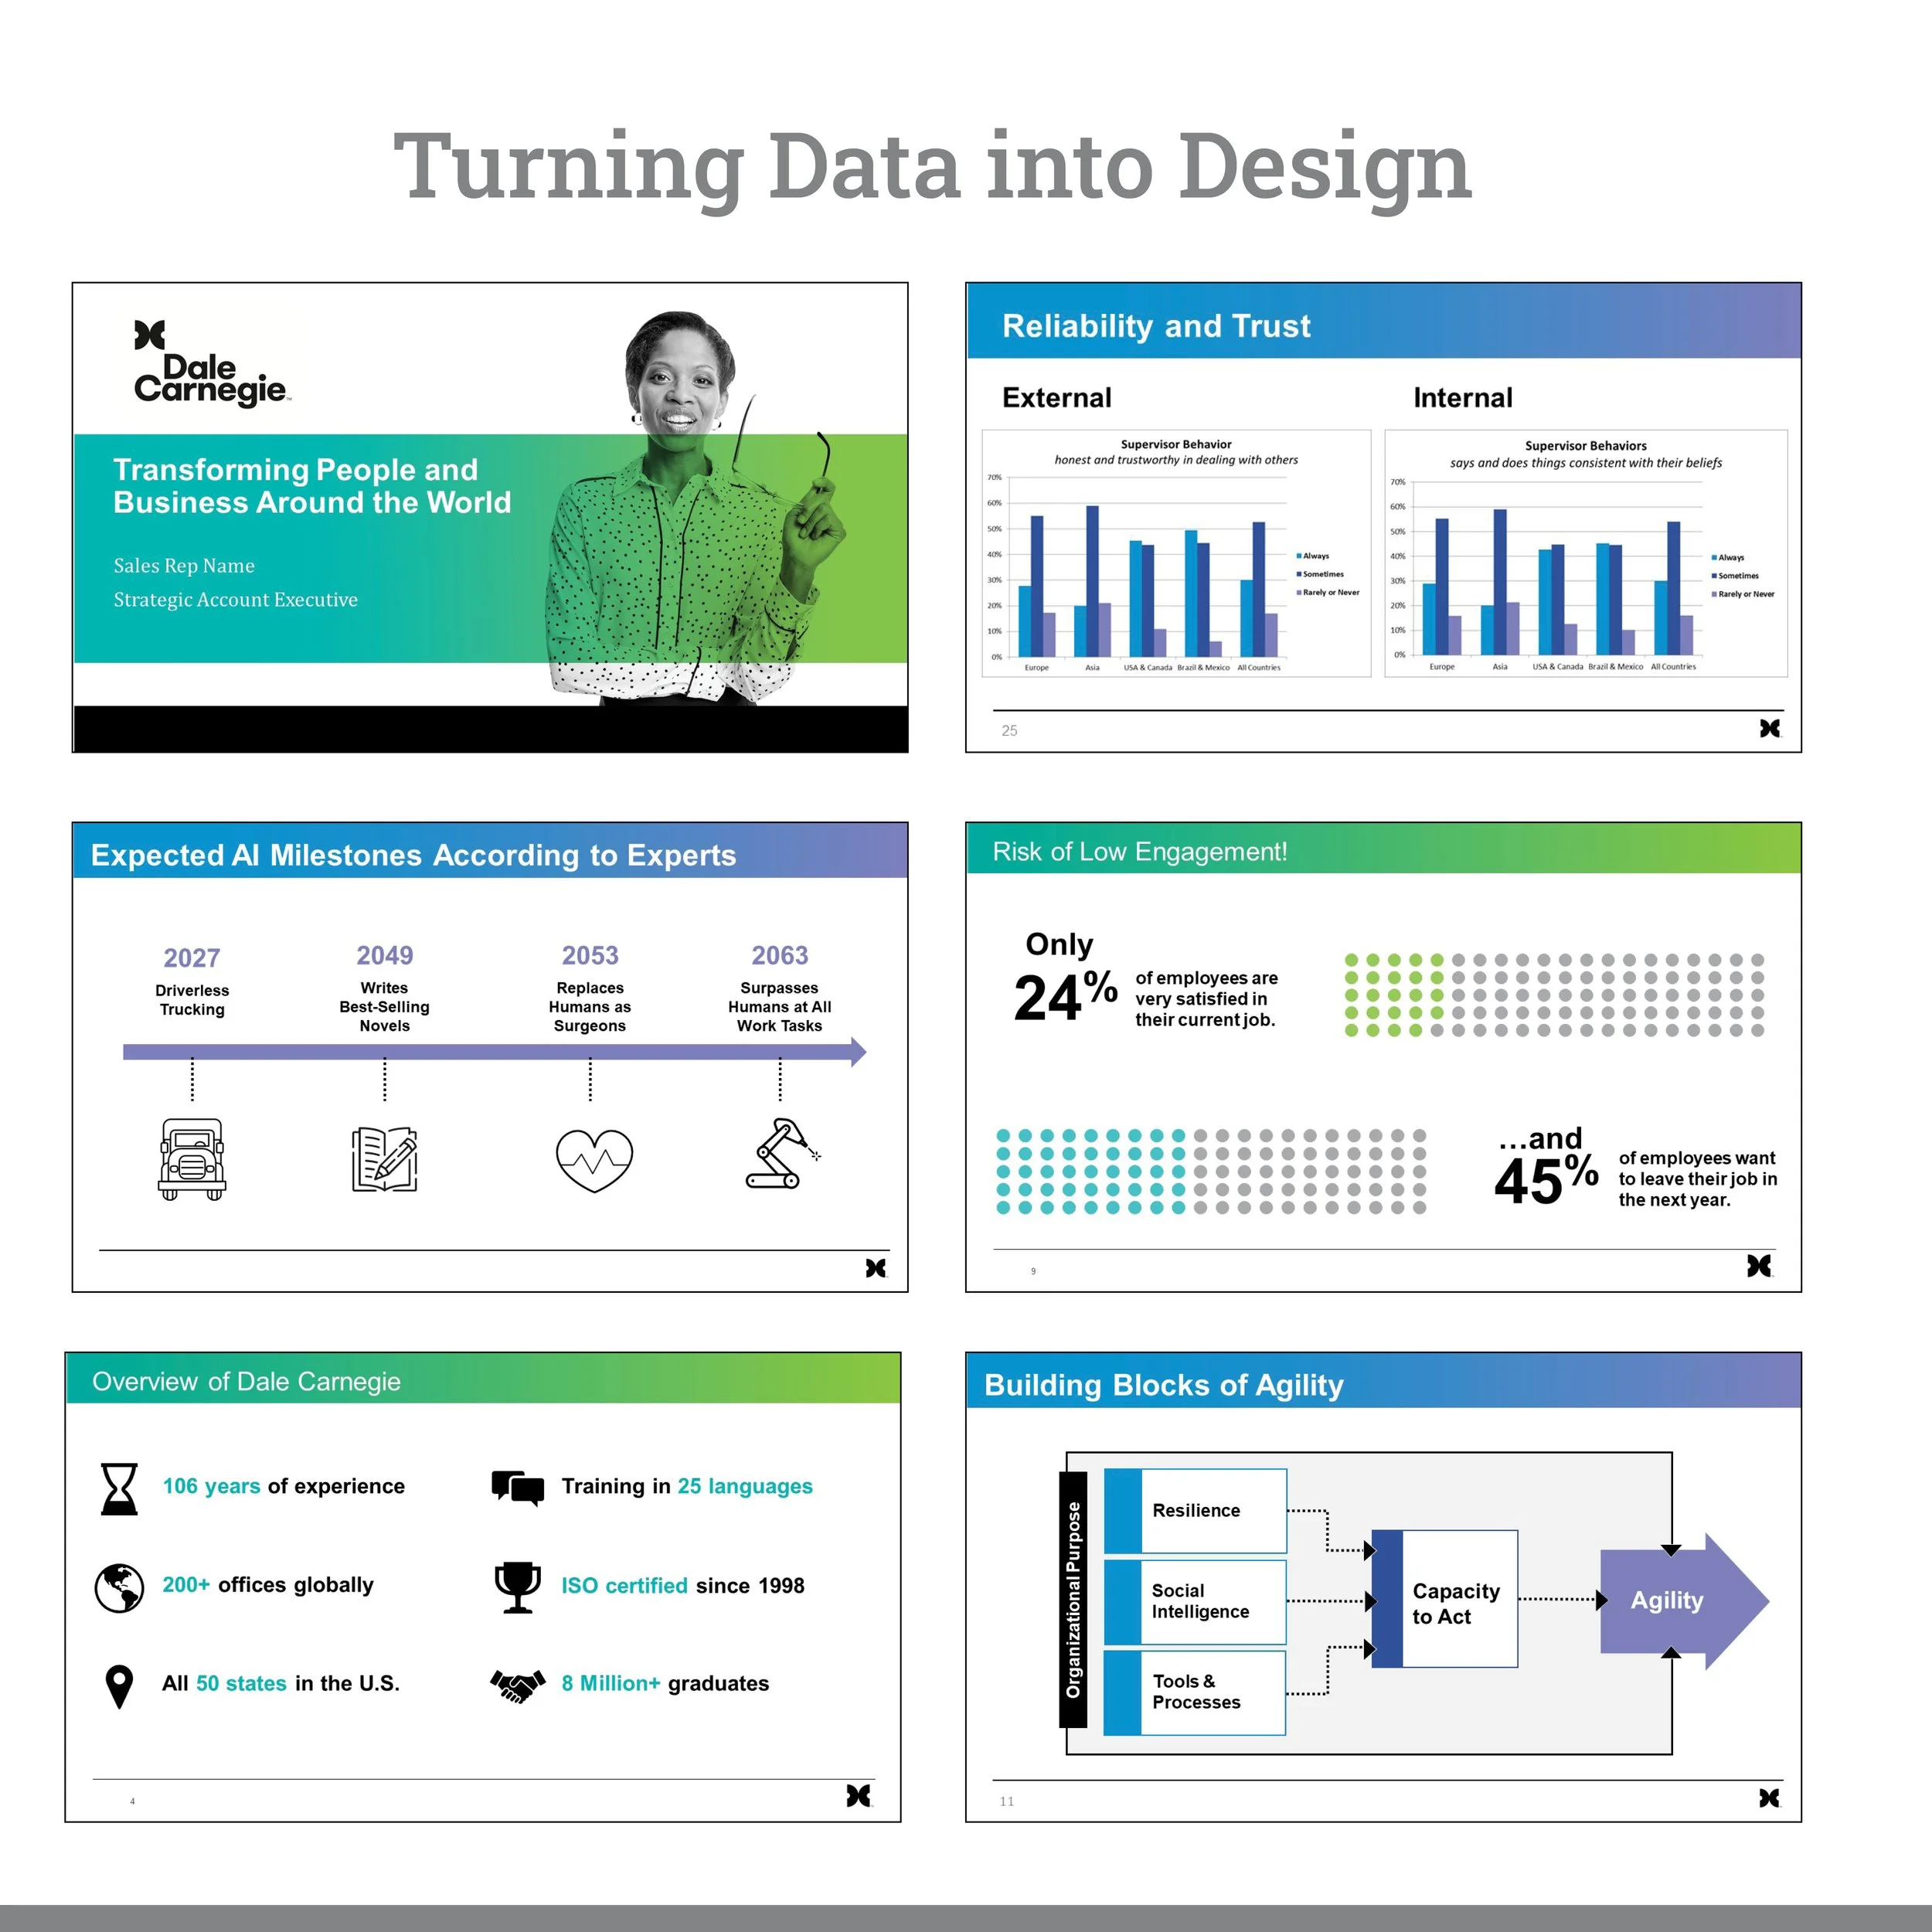
A presentation titled 'Turning Data into Design' by Dale Carnegie. It features slides on AI milestones, employee engagement statistics, reliability and trust, Dale Carnegie's overview, and building agility. Graphs, timelines, and icons illustrate concepts like employee satisfaction and AI advancements.
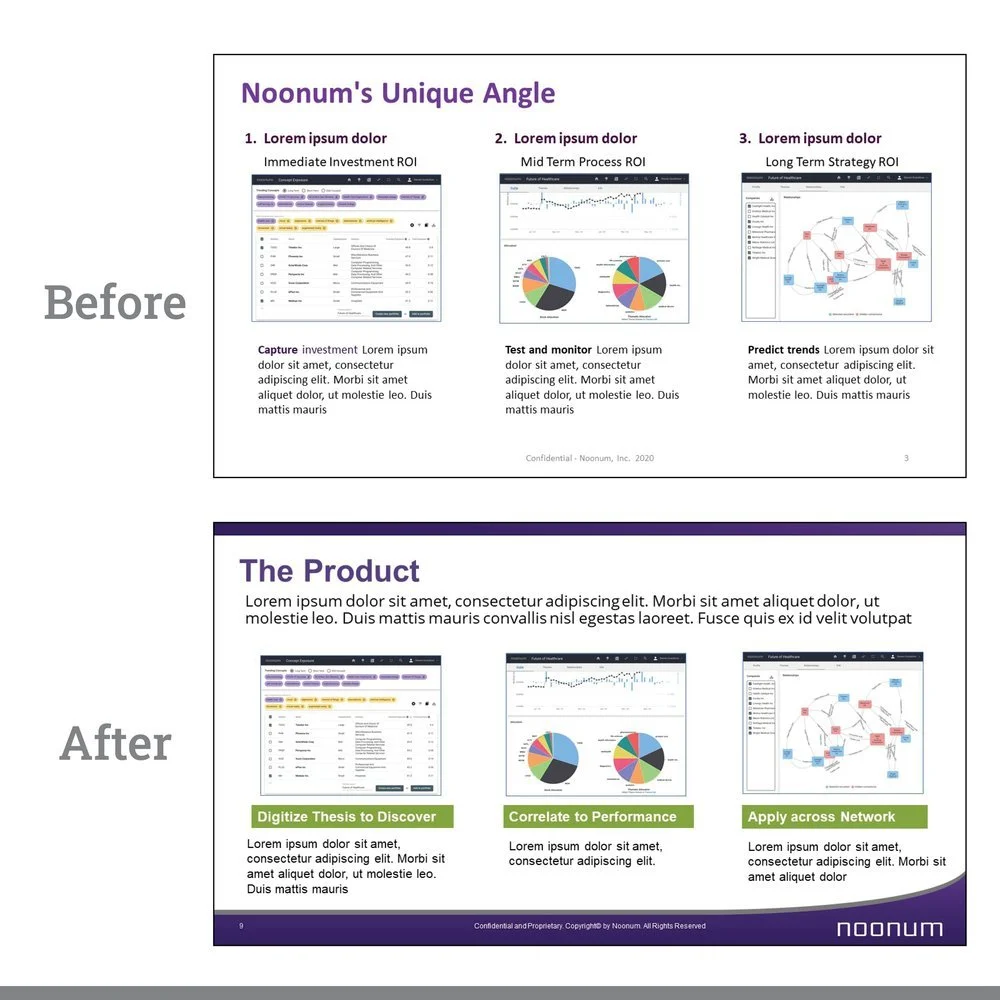
Comparison of two presentation slides labeled 'Before' and 'After' for Noomun's product. The 'Before' slide highlights 'Noonum's Unique Angle' with headings on investment ROI, process ROI, and strategy ROI, accompanied by graphs and charts. The 'After' slide is titled 'The Product' with updated headings: 'Digitize Thesis to Discover,' 'Correlate to Performance,' and 'Apply across Network,' also featuring similar visual elements. Both contain placeholder text and a footer noting the content as confidential and proprietary to Noonum.
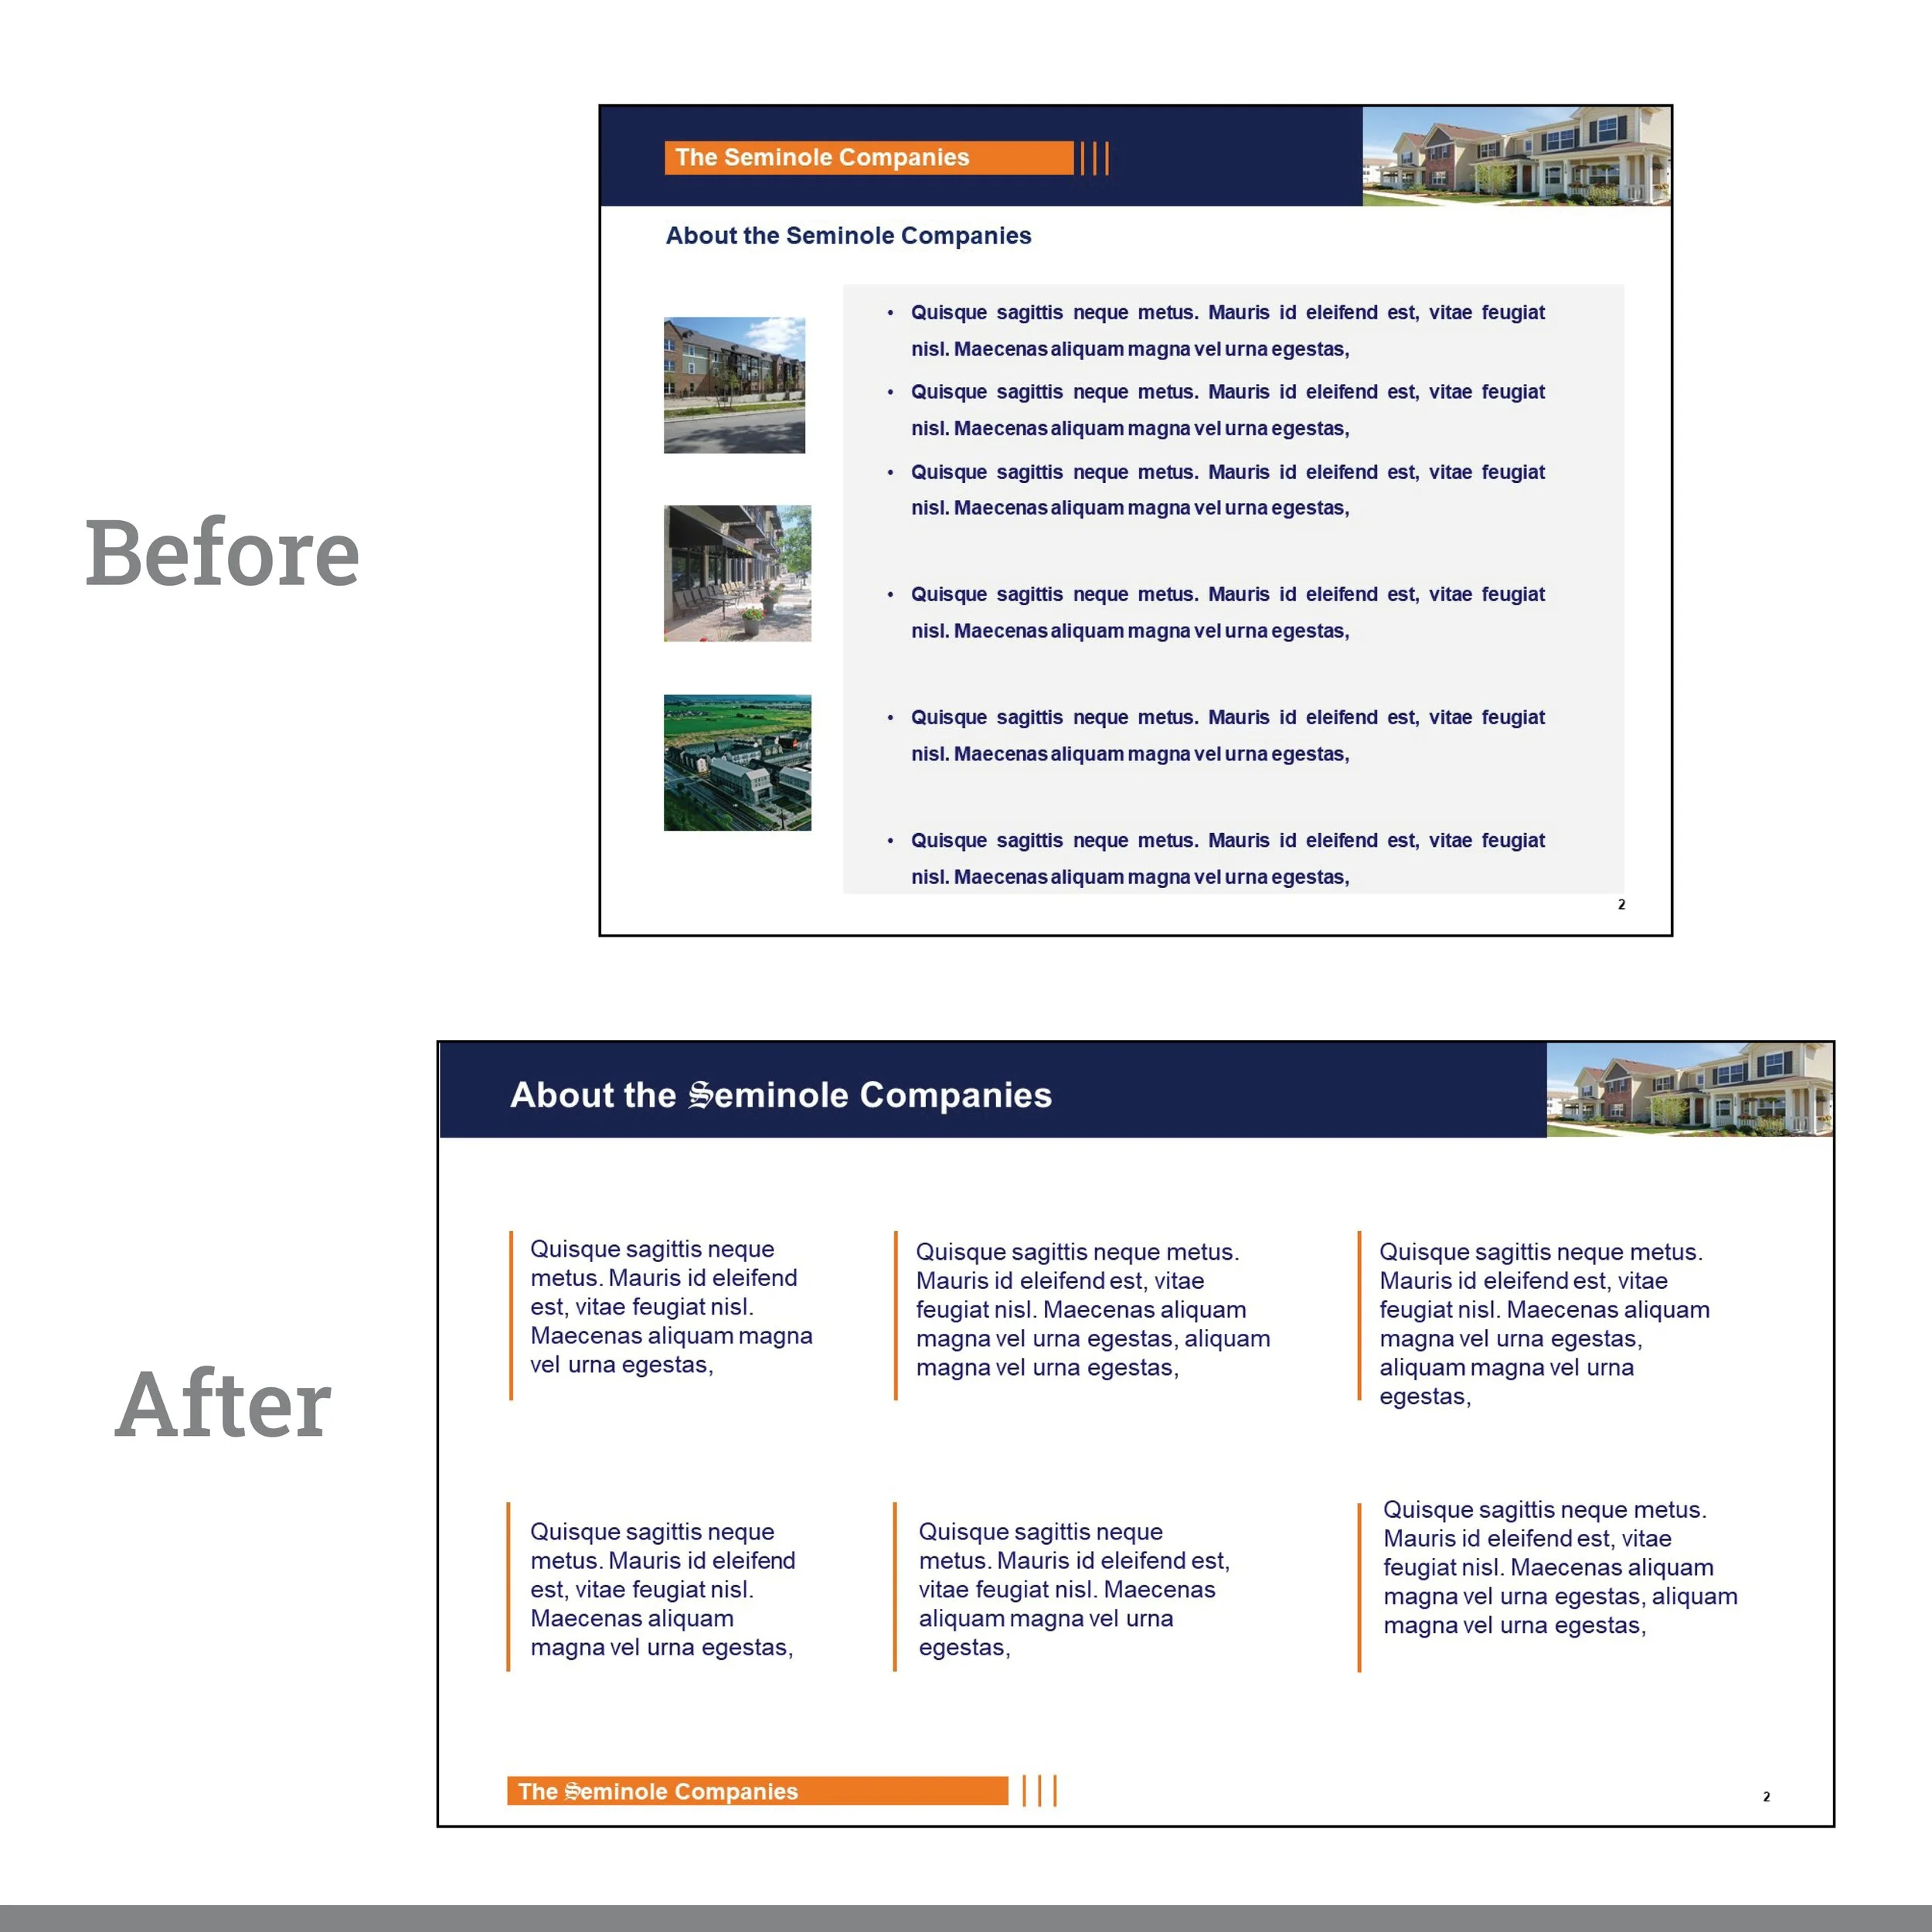
Comparison of a presentation slide before and after redesign for "The Seminole Companies." The "Before" slide has a single-column layout with text and images. The "After" slide features a multi-column layout, improved header, and no images, enhancing readability.
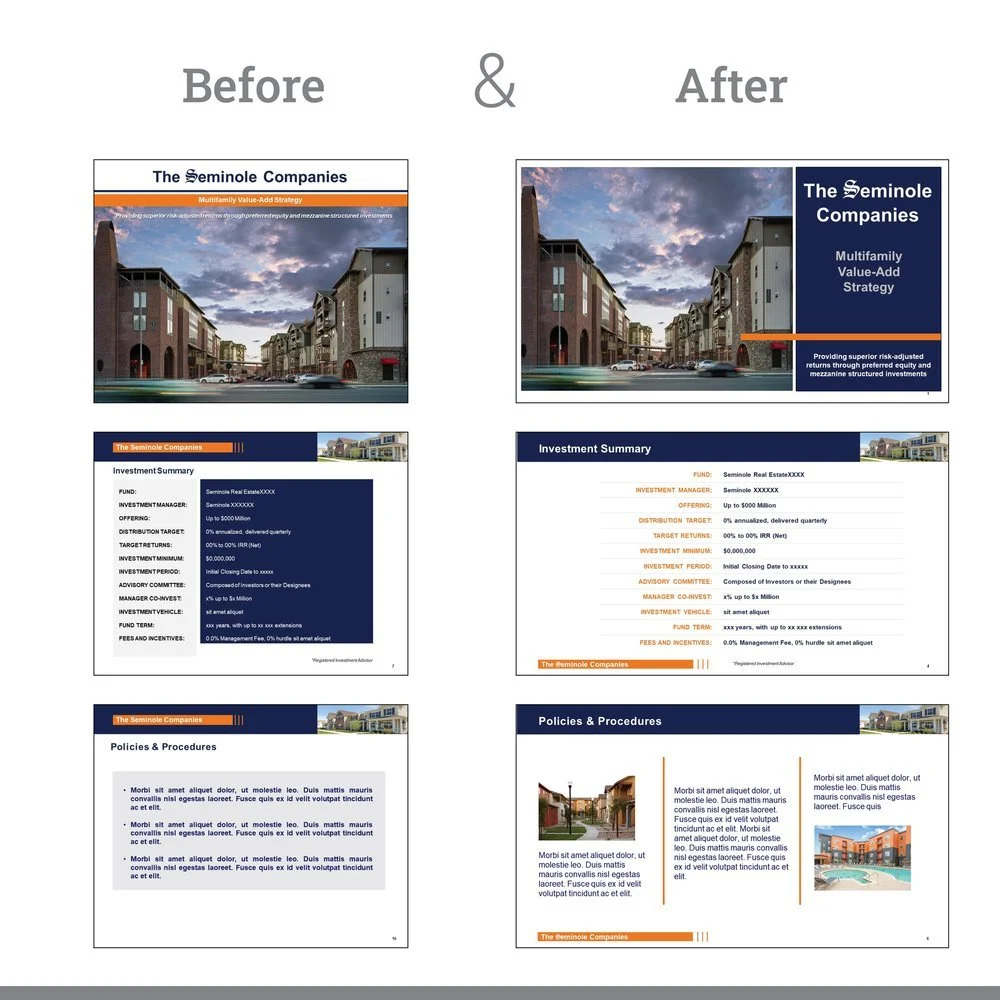
Comparison of presentation slides showing "Before" and "After" design improvements for Seminole Companies' investment summary and policies. Visible elements include text and images of buildings.

Comparison of presentation slides showing before and after designs. The 'before' slide is titled 'Traction and Pipeline' with bullet points and a bar chart titled 'Traction Statistics' for March, April, May, and June. The 'after' slide is titled 'Traction' with a more visually appealing design, featuring a testimonial box and the same bar chart. Both slides include placeholder text and business-related content.